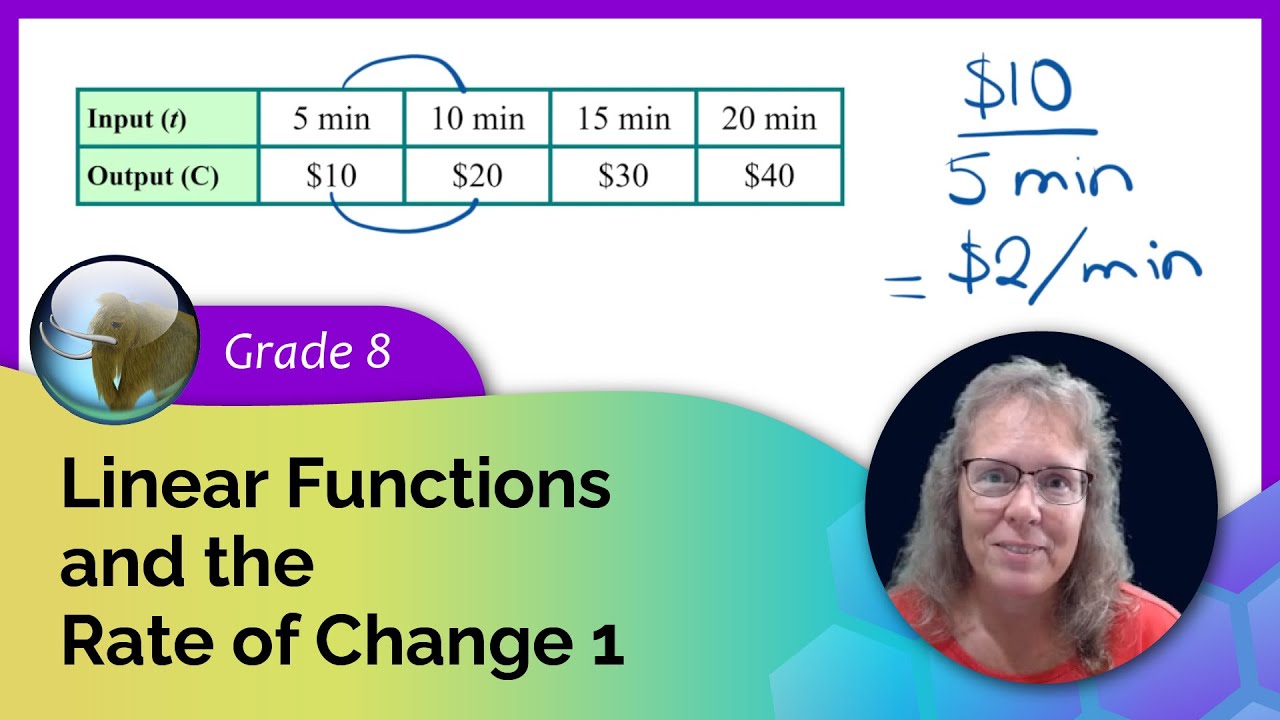
The rate of change of a function is this ratio: (change in the output values/change in the input values). We look at this concept through various examples, calculating the rate of change from tables of values and from the graph of a function. (Later on, you will learn this is the same as slope, in the context of graphing.) Math Mammoth Grade 8 Curriculum
आपको ये भी पसंद आ सकते हैं
Year1 Maths
Signal in catalog
Year 11 Math
Signal in catalog
Grade 1 Math
Signal in catalog
JSS 2 Junior Mathematics
Signal in catalog
Calculus
Signal in catalog
JSS1 Mathematics
Signal in catalog
Grade 3 Math
Signal in catalog
Grade 4 Math
Signal in catalog
Kelas 1 Matematika
Signal in catalog
SS2 Further Mathematics
Signal in catalog
Grade 5 Math
Signal in catalog
Year2 Maths
Signal in catalog
Year6 Maths
Signal in catalog
Year4 Maths
Signal in catalog
Year3 Maths
Signal in catalog
Year5 Maths
Signal in catalog
Year9 Maths
Signal in catalog
Year 2 Math
Signal in catalog
Year7 Maths
Signal in catalog
Year8 Maths
Signal in catalog
Maths
Signal in catalog
Year 4 Math
Signal in catalog
Year 8 Math
Signal in catalog
Year 7 Math
Signal in catalog
टिप्पणियाँ
4 टिप्पणियाँ
In mathematics, a function is a relation between two sets where each element in the first set is mapped to exactly one element in the second set. The first set is the set of INPUTS and the second set is the set of OUTPUTS. So, each input is mapped to exactly one output. But what if some of the outputs are the same? Is that allowed? What if some element has no output? For example, in the example about rooms and their colors, what if some room has no color assigned to it? Is it a function? We also look at some numerical examples where a function is given as a list of ordered pairs. A function can also be given as a rule, such as x mapping to x squared. We look at the graph of that function in the coordinate plane (for certain integer values only). Math Mammoth Grade 8 Curriculum https;//
In mathematics, a function is a relation between two sets where each element in the first set is mapped to exactly one element in the second set. The first set is the set of INPUTS and the second set is the set of OUTPUTS. So, each input is mapped to exactly one output. But what if some of the outputs are the same? Is that allowed? What if some element has no output? For example, in the example about rooms and their colors, what if some room has no color assigned to it? Is it a function? We also look at some numerical examples where a function is given as a list of ordered pairs. A function can also be given as a rule, such as x mapping to x squared. We look at the graph of that function in the coordinate plane (for certain integer values only). Math Mammoth Grade 8 Curriculum https;//
The rate of change of a function is this ratio: (change in the output values/change in the input values). We look at this concept through various examples, calculating the rate of change from tables of values and from the graph of a function. (Later on, you will learn this is the same as slope, in the context of graphing.) Math Mammoth Grade 8 Curriculum
The rate of change of a function is this ratio: (change in the output values/change in the input values). We look at this concept through various examples, calculating the rate of change from tables of values and from the graph of a function. (Later on, you will learn this is the same as slope, in the context of graphing.) Math Mammoth Grade 8 Curriculum